Mean time between failures (MTBF): turning 'it keeps breaking' into a number you can improve
Two identical pumps sit side by side, doing the same job on the same line. One quietly runs for months. The other always seems to be on the repair bench, and nobody can say exactly how often, only that the crew sighs whenever its name comes up.
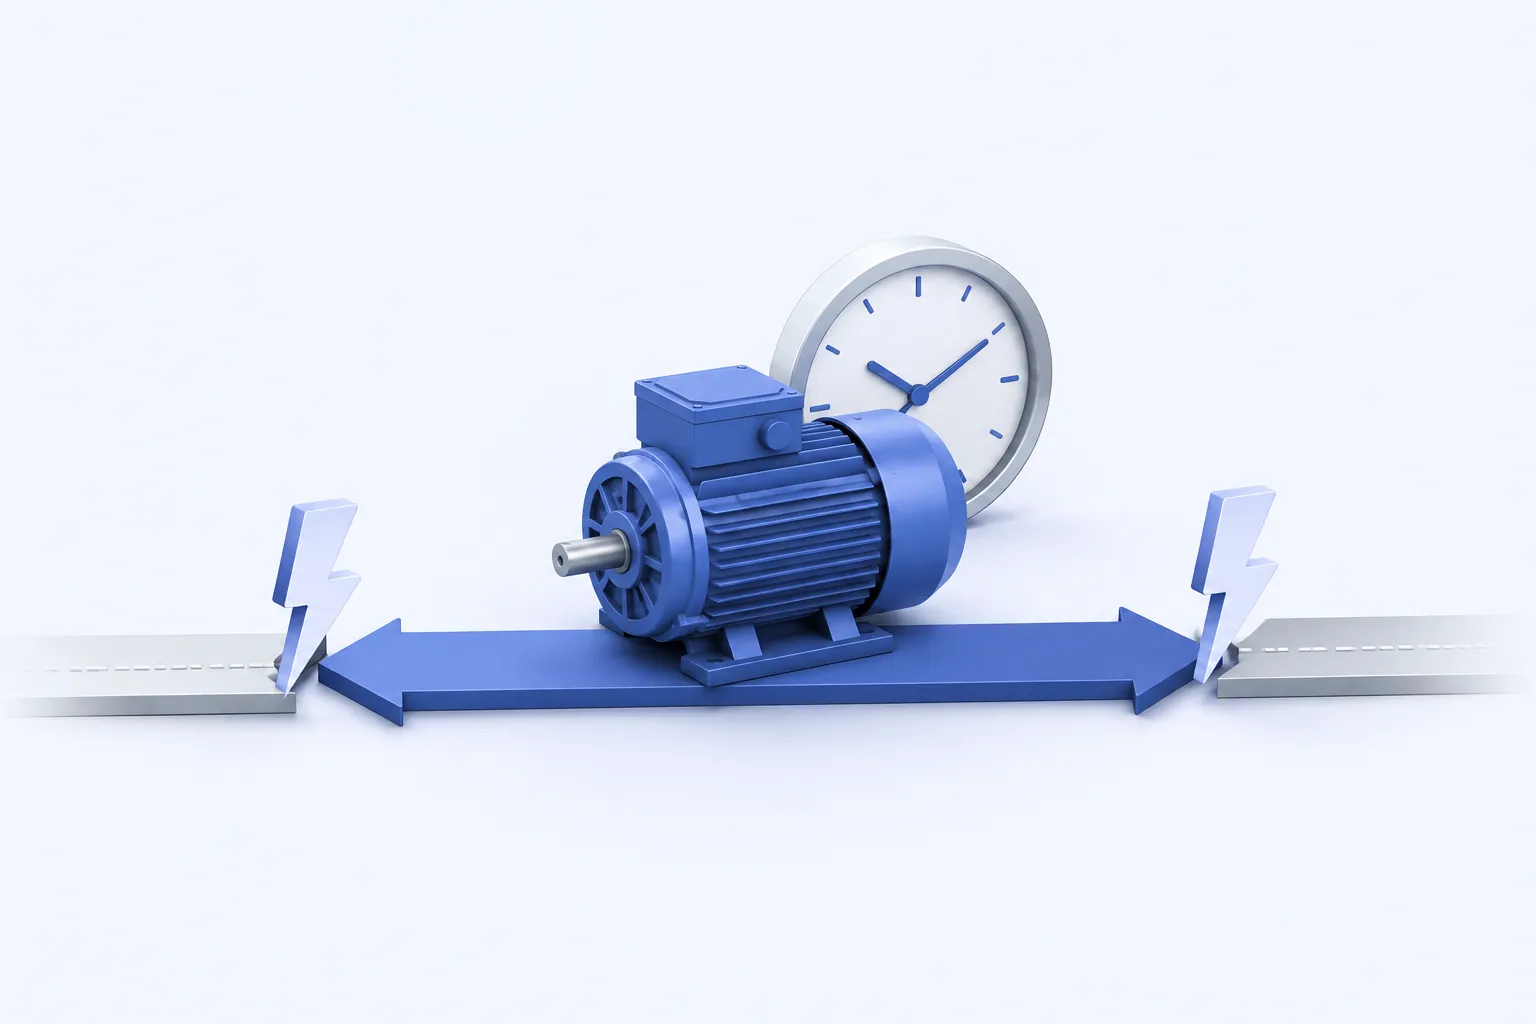
Two identical pumps sit side by side, doing the same job on the same line. One quietly runs for months. The other always seems to be on the repair bench, and nobody can say exactly how often, only that the crew sighs whenever its name comes up.
"It fails all the time" is a feeling. It will not help you set a budget, justify a redesign, or prove that a fix actually worked. Mean time between failures takes that feeling and turns it into a single, honest number, and once you have the number, a surprising amount of reliability work opens up from it.
What it actually measures
MTBF is the average running time an asset clocks up between one breakdown and the next. It is meant for repairable equipment, the pumps, conveyors and compressors you fix and put back into service; for things you throw away rather than repair, a bulb or a sealed bearing, its sibling is mean time to failure. You will sometimes see it written as mean time between repairs, which is the same idea for rotating equipment.
One subtlety worth holding on to: MTBF is duty-dependent. The same pump model handling clean water and abrasive slurry will post two completely different figures, so the number only means something set against a like-for-like asset doing a like-for-like job.
How to work it out
MTBF = Operating time (hours) / Number of failures
A transfer pump ran for 1,000 hours last quarter and broke down 10 times.
MTBF = 1,000 / 10 = 100 hours between failures
The next quarter the crew tightens up lubrication and alignment, and the same pump fails just 5 times in another 1,000 hours.
MTBF = 1,000 / 5 = 200 hours
Same pump, twice the reliability, and now the improvement is something you can prove rather than merely hope for.
What the average is hiding
Here is the catch that humbles everyone eventually: MTBF is a mean, and a mean can describe a reality that never actually happens. Run thirty identical bearings, from the same box, fitted the same way, under the same load, to failure, and they will not fail neatly around their average. Some go early, some run far past it, and the mean sits in a gap most of them skip straight over. Set a maintenance interval at that average and you manage to over-maintain the survivors and under-maintain the casualties at the same time.
It gets more interesting. For decades the assumption was that things wear out with age, the familiar bathtub curve, so a good MTBF could tell you when to overhaul. Then a landmark study of aircraft reliability took the idea apart: only a small minority of components, barely more than one in ten, showed a clear wear-out age at all. The great majority, well over 80% by most counts since, fail at random or suffer most in their infancy, right after installation or repair. The unsettling implication is that a scheduled overhaul timed off an average can make things worse, by resetting an otherwise stable machine back into its risky, early-life phase. So MTBF is the headline, but the distribution behind it, the spread and the shape, is the real story, and techniques like Weibull analysis exist precisely to recover it.
What it is actually good for
Treated as a starting point rather than a verdict, MTBF feeds a lot of decisions. It is the failure rate turned the right way up: invert it and you have failures per hour, which helps drive how many spares to stock and how often to inspect. Pair it with how long repairs take and you have availability, because an asset's uptime depends both on how often it fails and on how fast you recover. Those are two independent levers, and MTBF is the one that goes after the failures themselves. Above all, it points a finger: rank your assets by it and the handful at the bottom, the bad actors, are exactly where a root cause investigation or a redesign will pay back most. It even belongs in purchasing, where a serious reliability specification asks a supplier to commit to an MTBF and prove it, rather than discovering the answer the hard way after commissioning.
How to push it up
Lifting MTBF is rarely about trying harder; it is about removing the defects that cause the failures in the first place. The unglamorous fundamentals do most of the work: precision alignment and balancing, clean and correct lubrication, careful installation. The numbers attached to those basics are striking, with precision alignment programmes credited with multiplying bearing life several times over and lifting plant availability by double figures. Beyond the fundamentals sit root cause failure analysis on the bad actors and, where a component simply is not good enough, designing it out altogether. One supplier-alliance programme that combined better parts with shared failure analysis more than tripled the mean time between repairs on its pumps. Every failure you prevent is money saved as well, since a breakdown repair typically costs around three times the same job done on a plan.
What good looks like
There is no universal target, and chasing one is a trap. A good MTBF for a hard-working slurry pump looks nothing like a good MTBF for a standby fan. The right comparison is against the asset's own past, and against the identical units sitting beside it, with the trend pointed firmly upward. As one blunt piece of field wisdom has it, you do not need an engineer to tell you your MTBF is too small; you need to work out how to improve the reliability behind it. The question is never "are we at 500 hours?" It is "is this month better than last, and do we know why?"
Where it can mislead you
- Use it only for repairable equipment. For one-and-done items that are replaced rather than fixed, reach for mean time to failure instead.
- The average hides the spread, so always look behind it. Ten steady failures and one catastrophe can share an MTBF with a machine that fails like clockwork, and they are not the same problem.
- It is only as trustworthy as your data, and most organisations quietly admit their failure history is poor. Decide clearly what counts as a failure, measure operating time rather than calendar time, and be wary of conclusions drawn from a handful of events.
- A low or falling MTBF is a signal, not a sentence. Treat it as the trigger for an investigation, never the end of the conversation, and never let a number that is easy to game stand in for understanding why the asset actually fails.
MTBF is the headline score for how dependable your equipment is. When it climbs, your machines are becoming more trustworthy; when it slips, trouble is gathering. But its real value is not the figure on the dashboard, it is everything that figure sends you off to do: stock the right spares, find the bad actors, question the overhaul, and design out the defects that were quietly costing you all along.



