Total maintenance cost as a share of asset value: the benchmark corporate asks for first
Two plants in the same business, much the same age, sit side by side in a spreadsheet. One spends what looks like a fortune on maintenance. The other spends noticeably less. On the raw figures the first plant is the spendthrift and the second is t...
Two plants in the same business, much the same age, sit side by side in a spreadsheet. One spends what looks like a fortune on maintenance. The other spends noticeably less. On the raw figures the first plant is the spendthrift and the second is the model to copy, and that is exactly the conclusion someone is about to draw, until a quieter voice points out that the first plant is three times the size of the second.
The comparison was never fair, because it had no denominator. Put one in, express each plant's spend as a percentage of what it would cost to replace, and the picture can flip entirely. This single ratio is the most common way maintenance spending gets benchmarked anywhere in the world, and it is almost always the first number someone from head office asks to see.
What it actually measures
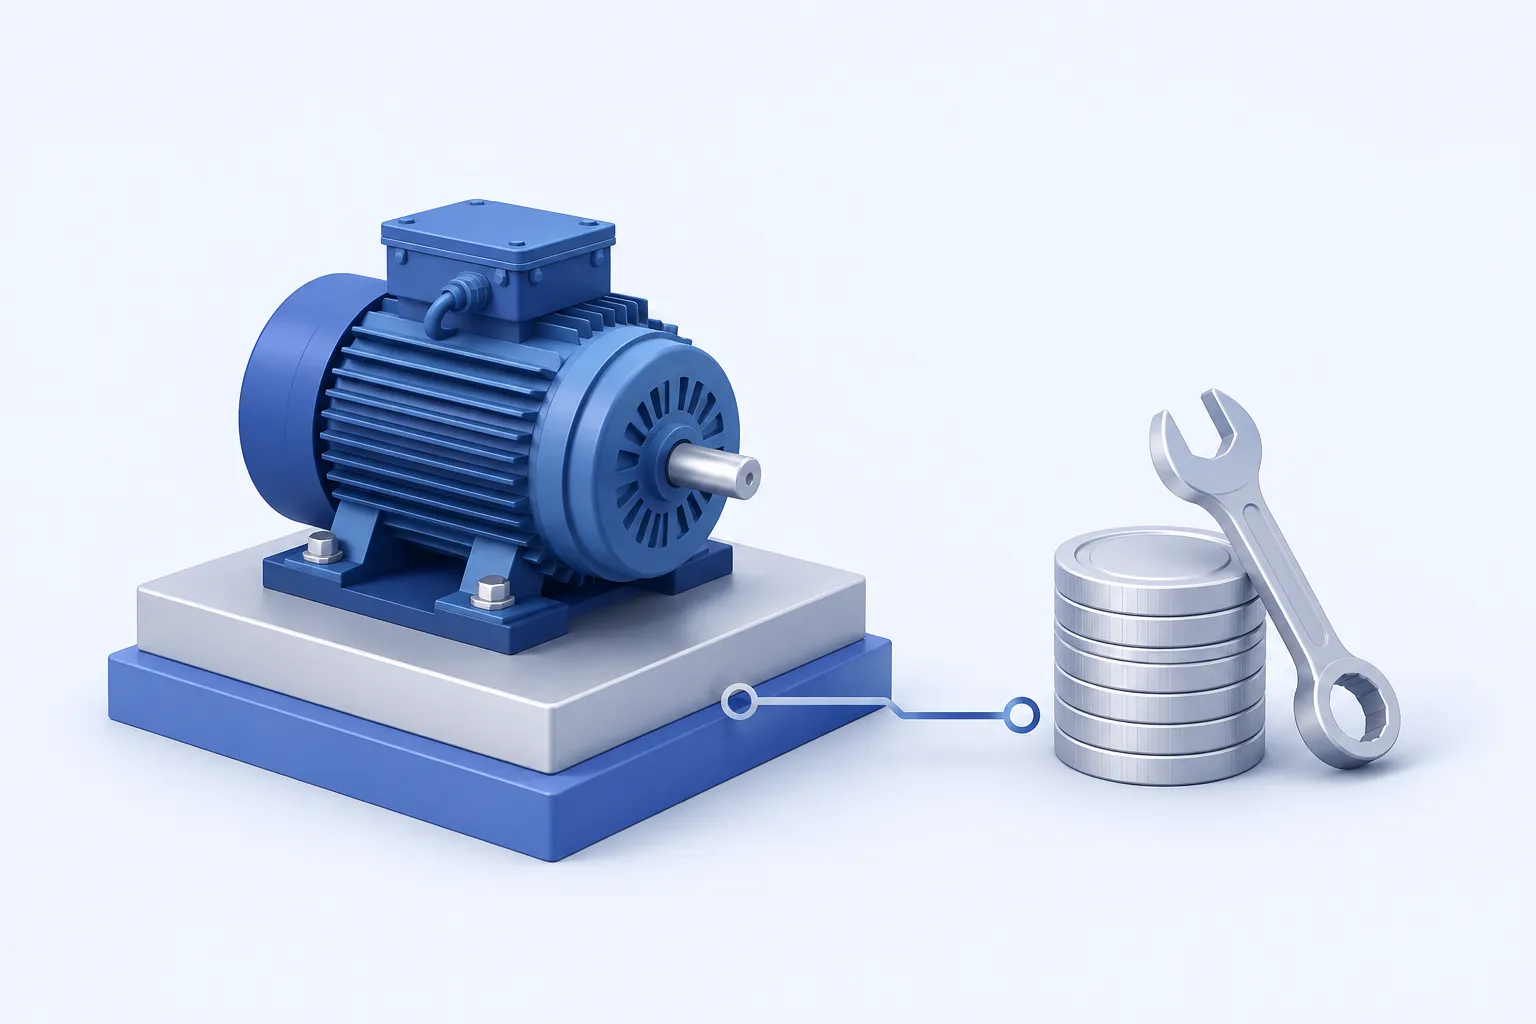
The metric is your total annual maintenance cost divided by the replacement asset value of the assets you maintain, read as a percentage.
"Total" is doing real work in that sentence. The numerator gathers up all of it: labour, materials, contractors and services, the cost of outages and turnarounds, and the capital you spend replacing machinery that has reached the end of its life. It leaves out only the capital that grows the plant or adds new capacity, because that is investment, not upkeep.
The denominator deserves equal care, because it quietly governs three different metrics. Replacement asset value is what it would cost to rebuild your current production capability, and it is neither book value nor an insured figure plucked from a policy. It usually comes from engineering, built up one of a few ways: from the original capital cost adjusted for inflation and later expansions, from a considered insured value, from a professional appraisal with land and working capital stripped out, or by scaling a similar known plant. Whichever route you take, define it once and hold it steady, because a loose or inconsistent replacement value does not just distort this ratio; it corrupts every metric that leans on it, and makes any comparison with another site meaningless.
How to work it out
Total maintenance cost as a share of asset value = (Total maintenance cost ($) × 100) / Replacement asset value ($)
Take a plant that spends $3,000,000 a year on maintenance and would cost $100,000,000 to replace.
Maintenance cost to RAV = ($3,000,000 × 100) / $100,000,000 = 3.0%
Three per cent of the plant's value, spent each year to keep it running.
What good looks like
This is one of the few maintenance metrics with a benchmark worth quoting, though the sources genuinely disagree on exactly where world-class sits, and it is honest to admit the spread. Depending on who you ask and how they define the terms, world-class lands somewhere between roughly one and three per cent of replacement asset value, with two to three per cent the most commonly cited band and the very best plants pushing lower. Typical operations sit a good deal higher, often anywhere from three and a half up toward nine. The divergence is real and comes mostly from industry type and from what each plant folds into the numerator, especially end-of-life replacement, so take the headline figure as a region rather than a line and get advice for your own sector before fixing a target.
Why do the best plants spend less? Because reliable equipment simply needs less fixing. Planned work is cheaper than emergency work, and money spent before a failure goes further than money spent after one. A falling ratio, earned the right way, is the financial signature of a plant that has learned to stop firefighting.
Why a low number can be a warning
Here is the trap, and it is a serious one: a low percentage is not automatically good news. Spend can be cut by deferring the work the plant actually needs, and for a year or two the ratio looks wonderful while the assets quietly degrade beneath it. The bill always arrives in the end, usually as a bigger failure later, so a plant showing both low cost and low uptime is very often not thrifty but under-maintained.
There is a subtler version, too. One plant posted an enviable figure of under one per cent simply because its wages were a fraction of the going rate; price the same hours at standard rates and the number climbed toward one and a quarter, and a closer look showed it had been "saving" by skimping on maintenance its reliability could not really afford. The counter-intuitive conclusion in cases like that is sometimes to spend more, not less, because on a high-margin product the extra uptime pays for itself many times over. The number is a starting point for a conversation, never the verdict on its own.
When the figure does need to come down, the smartest first move is not a broad cut but a precise one. In most plants a small share of the assets, often about a fifth, drives the great majority of the corrective bill, so hunting those bad actors with root cause analysis returns far more than trimming everywhere at once.
Spend up before you spend down
The deepest point about this metric is that it is a lagging indicator, the financial echo of choices made months earlier in planning, prevention and reliability. That has a counter-intuitive consequence for any plant trying to improve: the path usually runs up before it runs down. A reactive operation that wants to become reliable typically has to spend more first, building the preventive and predictive programmes that eventually let the cost fall, and a plant that tries to cut before those practices are in place simply lets its assets degrade and pays more later. Watching this ratio fall is satisfying, but only when it falls because reliability rose, not because the work was quietly skipped.
A few more things to keep straight:
- Keep end-of-life machinery replacement in the numerator. Leave it out and a plant running its assets into the ground looks cheaper than one responsibly renewing them.
- Do not confuse this with maintenance as a share of sales or of manufacturing cost. Those are useful companion ratios, but they have different denominators and different meanings; asset value is what makes plants of different sizes comparable.
- Measure it over a full year. The timing of big turnarounds will whip a shorter period around and tell you nothing about the underlying rate of spend.
Spend, in isolation, is just a big and slightly frightening number. Set against the value of the plant it maintains, it becomes a fair, portable measure that a fifty-person workshop and a billion-dollar refinery can both be judged by. Just remember which way is genuinely good: the aim is the lowest ratio your reliability can honestly support, not the lowest ratio you can reach by looking away.



